Revenue Efficiency of Value Added Tax and Corporate Income Tax

Value Added Taxes (VAT) and Corporate Income Taxes (CIT), are usually two of the instruments, individually considered, that contribute the most to a country’s revenue collection.
In the last recorded period (2016 to 2018), the total tax burden of the countries considered was equivalent to 21.4% of GDP, on average. And the tax burden specifically of VAT and CIT represented practically 50% of the former, with a greater or lesser presence of each of these figures in the different countries.
Tax Burden: Total, VAT and CIT
Latin America and the Caribbean
Average 2016 – 2018
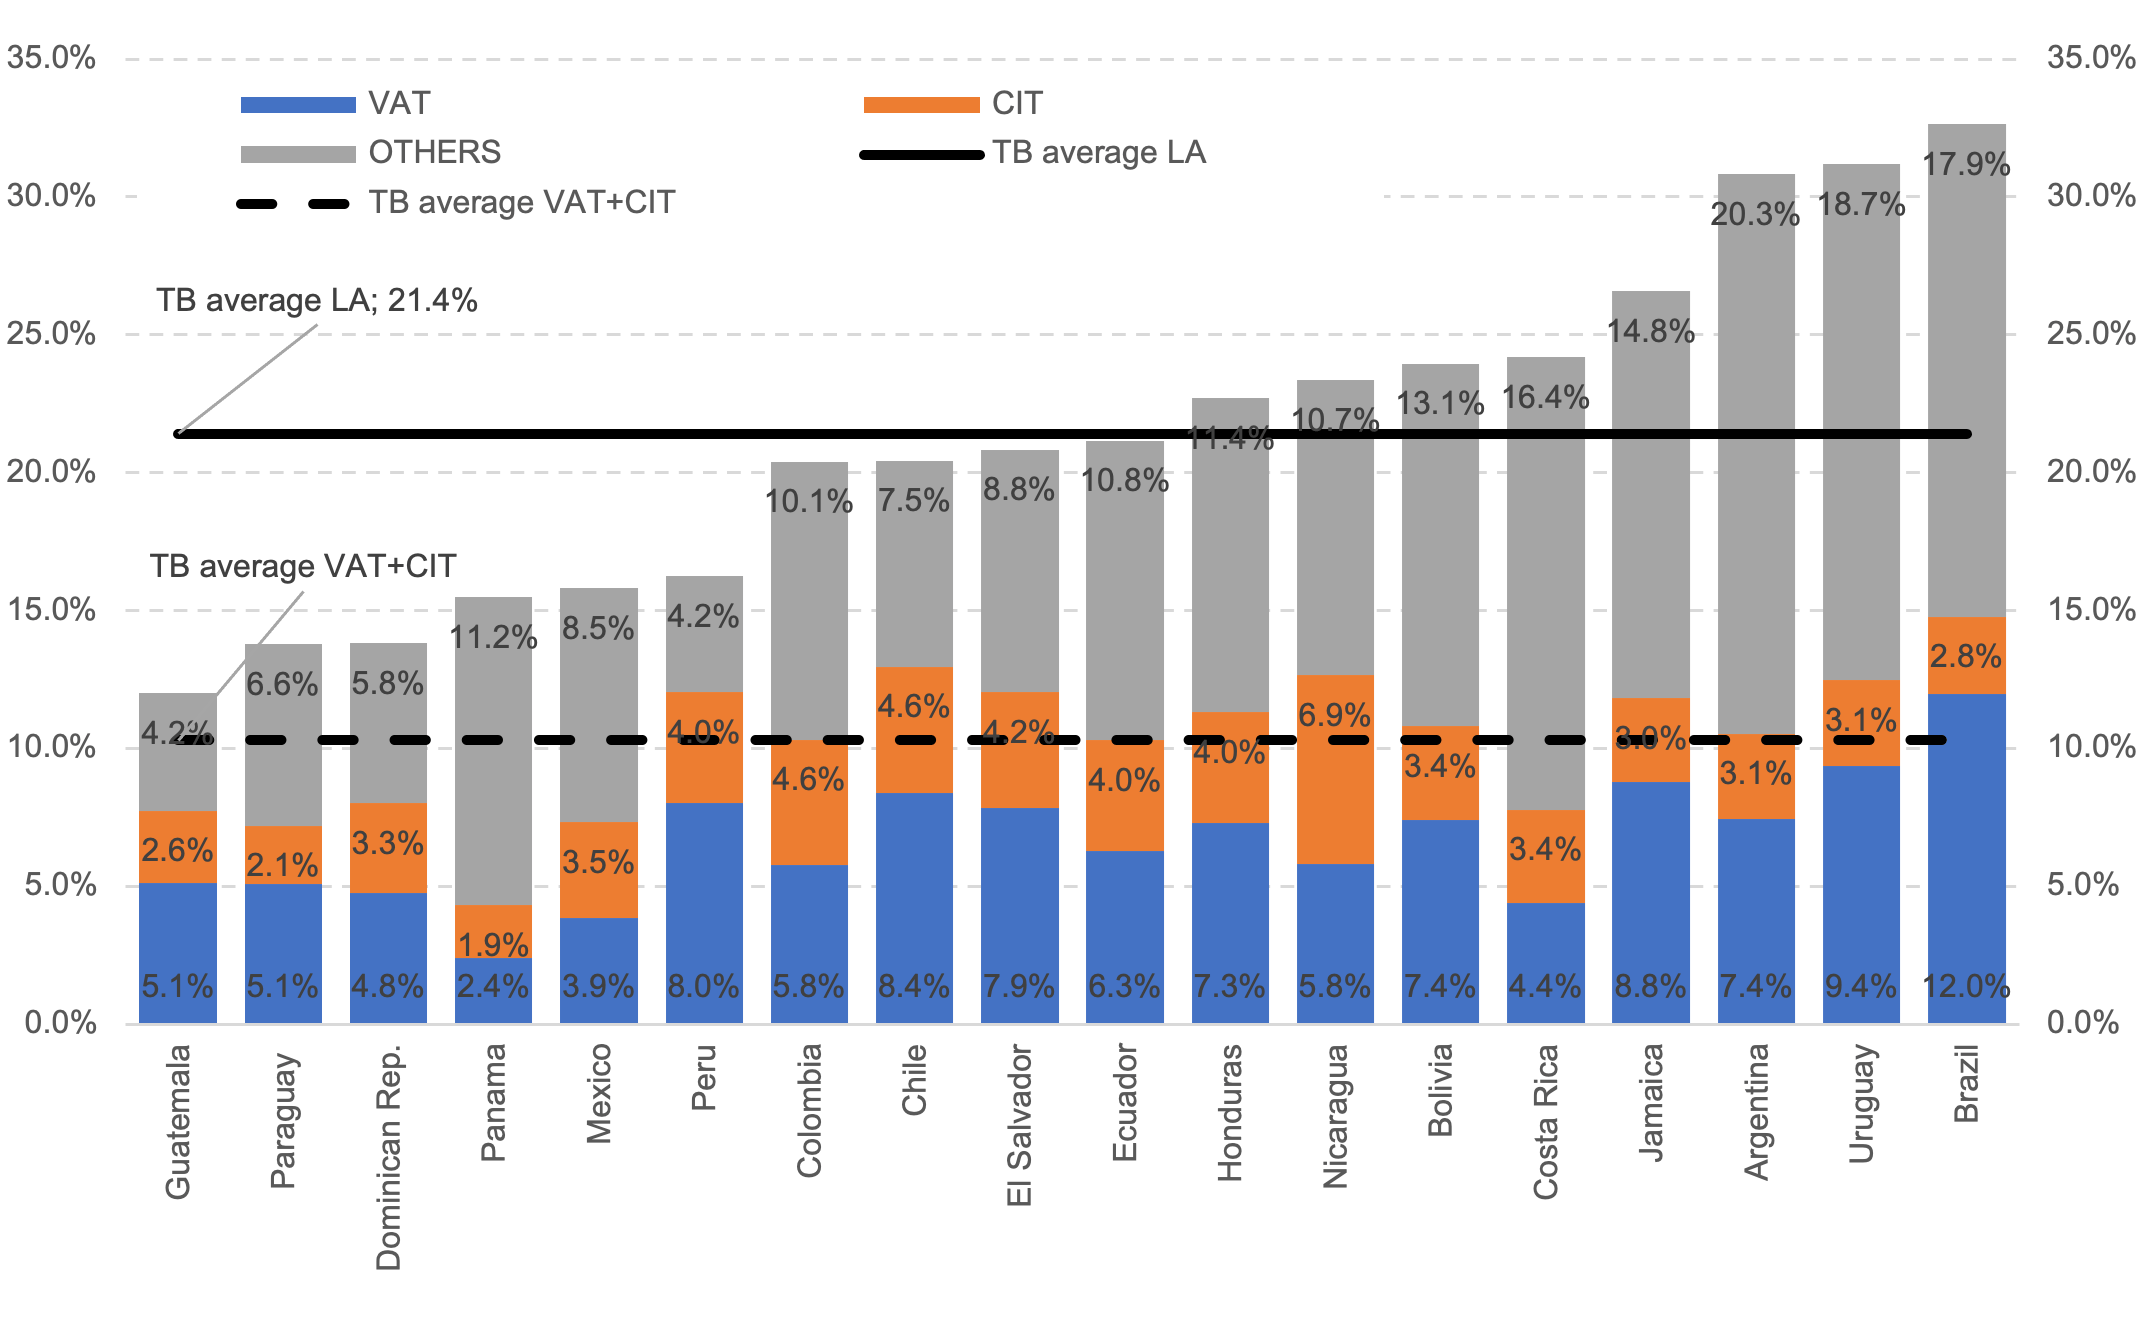 Prepared by the authors, based on IDB&CIAT statistics and national accounts series of the countries.
In a long-term outlook, the average tax burden in LAC has been consistently increasing year after year (except for 2008 and 2009).
While in 1990 tax collection represented 16.3% of GDP, on average, in 2018 the tax burden was 21.6%. In this period, the VAT and the CIT are the ones that most explain this growth. VAT and CIT, which currently represent 50% of the average tax burden in LAC, at the beginning of the series had an incidence of 30% of the total.
This greater participation of both figures can be explained by successive reforms concentrated on these taxes, which have been applied by the countries of the region, expanding the taxable bases, reducing exceptions and a greater concentration of the Tax Administrations in the management of these taxes.
With regard to rates and being mainly taxes that apply a proportional rate to the tax base, we observed a gradual increase in VAT rates in the countries during the period under analysis, while maintaining a certain heterogeneity and a reduction towards convergence in the CIT rates.
VAT and CIT Legal Rates. Average of LAC.
1990 – 2018
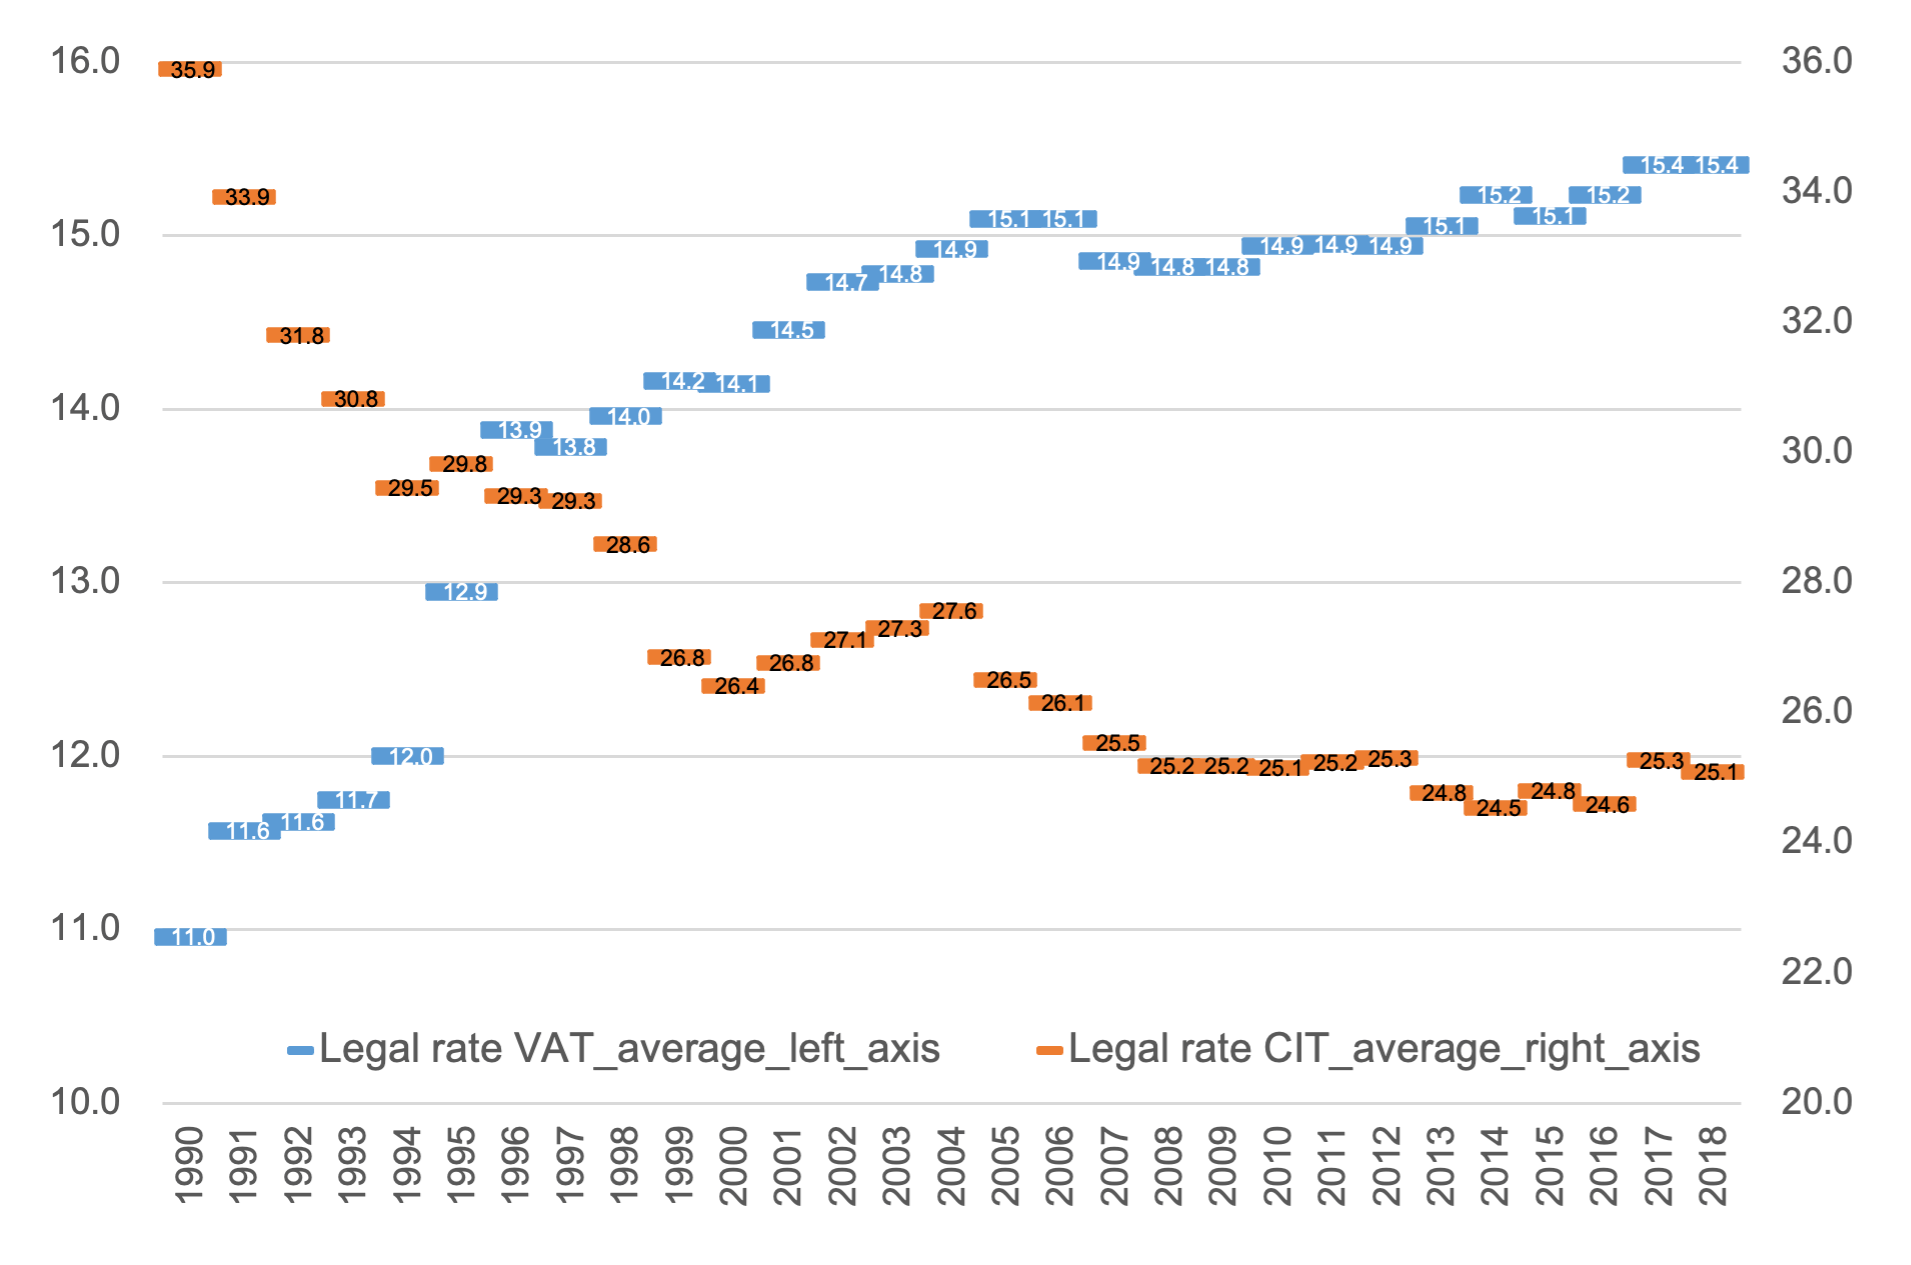 Prepared by the authors, based on Tax rate CIAT series and country legislation.
Revenue Collection efficiency.
This work, we invite you to read, analyzes the collection performance of these taxes over a long period of time, up to the last few years. The quantitative development is based on estimates of collection efficiency indicators for each tax.
The results of the analysis indicate that revenue collection efficiency increased throughout the analysis period. Although the revenue collection efficiency of the CIT is lower than that obtained from the VAT, it was observed that the evolution of the former had a better performance, especially in the most recent periods, where the VAT revenue collection efficiency remained flat.
We estimate the theoretical collection, and the contrast with the actual collection with the theoretical collection will allow us to obtain the revenue efficiency of the tax. With the available data we will be able to estimate a long series of revenue collection efficiency and infer whether the observed improvement in tax collection is attributable only to nominal upward changes in rates or also to an improvement in the intrinsic collection capacity of each tax.
If the effective collection were to reach the same magnitude as the theoretical collection, we would be facing a tax that collects its full potential, a theoretical case in which there would be neither a policy gap (tax expenditures) nor a non-compliance gap (evasion). The empirical evidence will show that the revenue collection efficiency is less than 1, since the effective collection is less than the potential collection. The overall gap will be determined as the difference between 1 minus the quotient between the effective collection and the theoretical collection.
VAT Revenue Collection Efficiency 1990 – 2018 (1.a)
Components of Theoretical Collection 2016 – 2018 (1.b; 1.c)
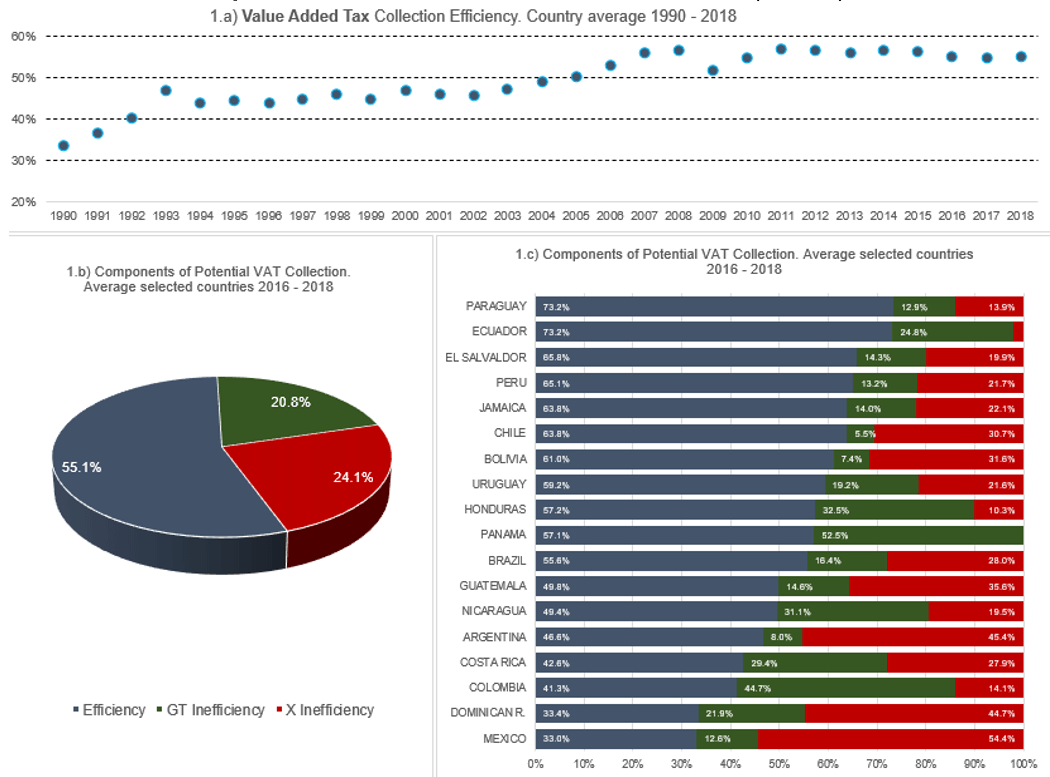
First (Figure 1.a) we show the average VAT revenue collection efficiency for the period 1990 – 2018. It was calculated as the annual average of the revenue collection efficiency found in each country.
This result explains why this tax plays such an important role in tax collection and why it explains the sustained growth of the tax burden during the period analyzed. In addition to the fact that the tax collection capacity grew, measured in this indicator through the increase in legal rates, revenue collection efficiency did not neutralize this effect, but on the contrary strengthened it, since increases in revenue collection efficiency in scenarios of an increase in the instrument’s collection capacity will result in improvements in collection levels.
Figure (1.b) shows statically the composition of the theoretical VAT revenue calculated as the average of the composition of the theoretical revenue of the countries included in the analysis.
Figure (1.c) shows statically the composition of the theoretical VAT collection at the country level.
To read the details on the methodological development of these indicators, to know the results for the Corporate Income Tax, and to obtain the results tables, we invite you to download the complete publication, available at the CIAT library.
6,136 total views, 7 views today