Explain the past, predict the future
Indicators and measurements
 There are many ways to present statistics and indicators and their evolution over time. The best one I have seen, by its importance, its format, the conclusions one can reach, is on the Institute for Health Metric and Evaluation website (1) . I strongly recommend a visit to the site and to explore the data displaying tools. The available information is about the people’s causes of death, the years of health depleted in the different regions and countries from the world in a period from 1990 to 2010.
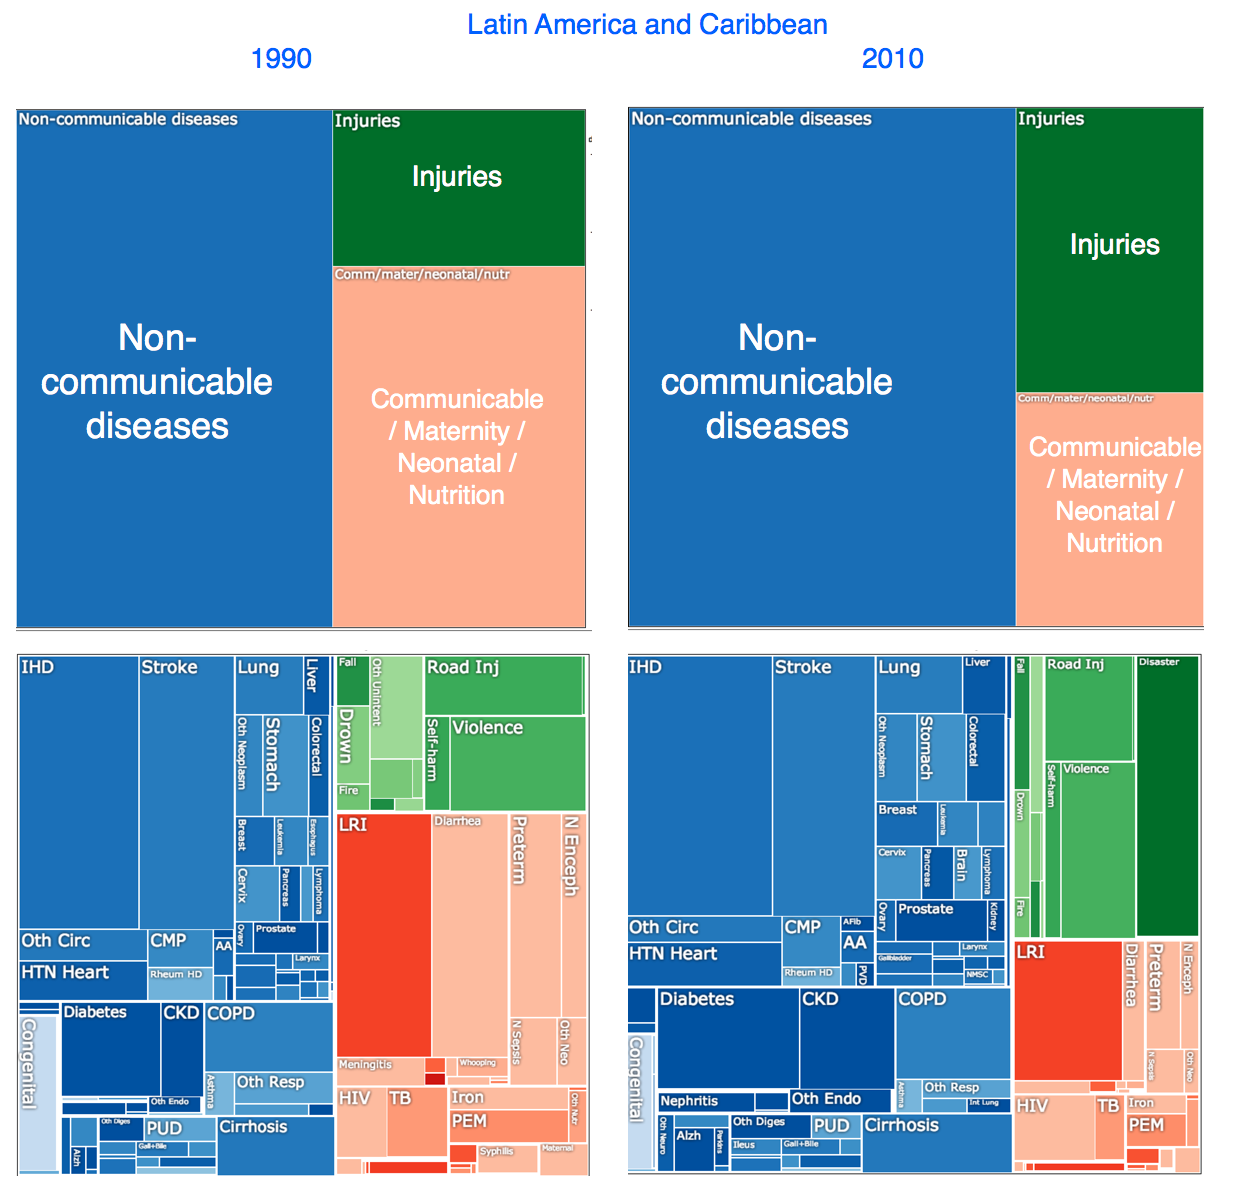
If the previous description still does not motivate you to visit the site, or if you do not want to spend time on it, I must confess I spent a pair of hours devouring those tools, graphs and pictures, and if you want to spend just a short time in the process I invite you to visit the tree GBD diagrams (2). These diagrams separate the causes of death in five levels of depth: in the superior level are the noncontagious diseases; the accidents or wounds; and contagious diseases and the causes related to the maternity, the births and the malnutrition. At deeper levels, each one of these three groups ramifies further, and among the divisions for each one are: In te first group, cardiovascular and lung diseases; in the second group, disasters and homicides; in the third group, diarrhea and AIDS. The table shows that for the developed and for the developing world, at any level of depth, the relative participation of each type is very different. As expected, in developing countries, the lower the development level, the higher will be the relative proportion of death by contagious diseases, and those related to maternity, malnutrition and salubrity. It also allows to easily verifying how, in Latin America, the great majority of countries have improved significantly their health conditions in relation to the causes of death associated to poverty in the last two decades.
I am copying very textually the conclusion that the Institute places on the GDB main page indicating that the new data shows that the world faces new health challenges: “Alzheimer is the health threat that grows most quickly in the United States, while AIDS and alcohol are eroding the health of Russians. Violence is taking lives of young men in wide urban areas in various parts of Latin America.”
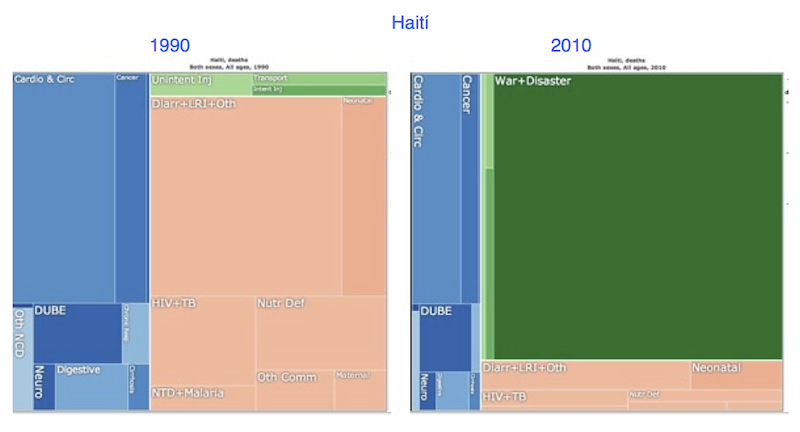
The two diagrams below show the evolution of the tree for Latin America and the Caribbean between 1990 and 2010. And the one below is for Haiti, showing the magnitude of that year´s tragedy.
A very old saying, which we still like to hear, is “what is not measured cannot be managed”. Tax administrations, of course, measure many things. The collection, its percentage originating from of actions of the administration, the amounts processed in tax returns; the number of new taxpayers, the amount of returns submitted via Internet, the amount of returns replaced spontaneously by the taxpayers; the time of availability of electronic services, the time necessary to take care of taxpayers in agencies or in call centers, the perception on the quality of services; the average time required to complete a control for large or small taxpayers, the percentage of cases in which their control or audit selection resulted in real adjustments, the percentage of adjustments determined by the administration that were appealed in administrative or judicial procedures, and the percentage of these ones that were confirmed; the number of computers by public officer, the fleet fuel cost, the percentage of air conditioning that didn’t receive maintenance; the amount of people with overdue vacations, the average age of public servants by area, the percentage of people who received training during the last 12 months; etc.
The literature recommends that no executives should maintain more than eight or nine key indicators under their control. Having too many indicators to control is a distraction. To define which indicators are the most appropriate for each executive is not an easy task and surely it requires a lot of balance allowing to measure the institution’s performance, or an area’s performance, or the financial management, the administrative management, the human talent, or the leadership. That selection of indicators must be intelligent (3): specific, Measurable, Attainable, Relevant and timely (4).
Many indicators aim to identify management results, or individual processes. To indicate, often accurately, if the goals were reached or if they are still out of reach. Some can help to identify future problems such as the collection originating in withholdings that can “foretell” a global fall in following periods. But few measures can surely serve in a categorical way such as the one that the IHME discloses to evaluate the evolution of a Tax Administration. Is it the fiscal pressure? Maybe. I imagine that in addition to the traditional curve, a tree diagram could be applied, where the quadrants would represent in their upper level the direct taxes, indirect taxes and others. And in minor levels, to separate personal or corporate incomes, and these by their origin in relation to capital or labor, into assets, or successions; the indirect ones in value added, specific taxes, tariffs, etc.; and the others into sales taxes on currencies, into financial transactions, simplified substitute regimes, certain amnesties, etc. It will be interesting to see if an improvement in the tax pressure is also accompanied by a change in the relative participation of each class. But surely, the tax administration will not be so easy to be determined.
A variable that I would propose will be related to the budget. To know how an administration spends and invests. In the same period, the great majority of tax administrations significantly altered to the composition of their expenses and investments, regarding their proportion on the total. For example, in 1990 many administrations used a significant proportion of resources transforming information from returns into paper in data available to the information systems; several administrations had internal services within their infrastructure to handle money, other began early to collect through the banking network; several administrations were structured under functional criteria and the specialization for large taxpayers (or simplified regimes for small taxpayers) had not yet started; the topics of international taxation and exchange of information still did not appear; and for many, the risk management was still unknown. Today more money is spent in collecting third party data than in electronic services widely used to submit returns online; the transaction cost for electronic payments is surely smaller than what was paid twenty years ago; there are many tax administrations that have specific units to manage the relations with large companies, and the international taxation, the exchange of information and the transfer pricing are topics in which the administrations invest in material resources, training, qualification and technology.
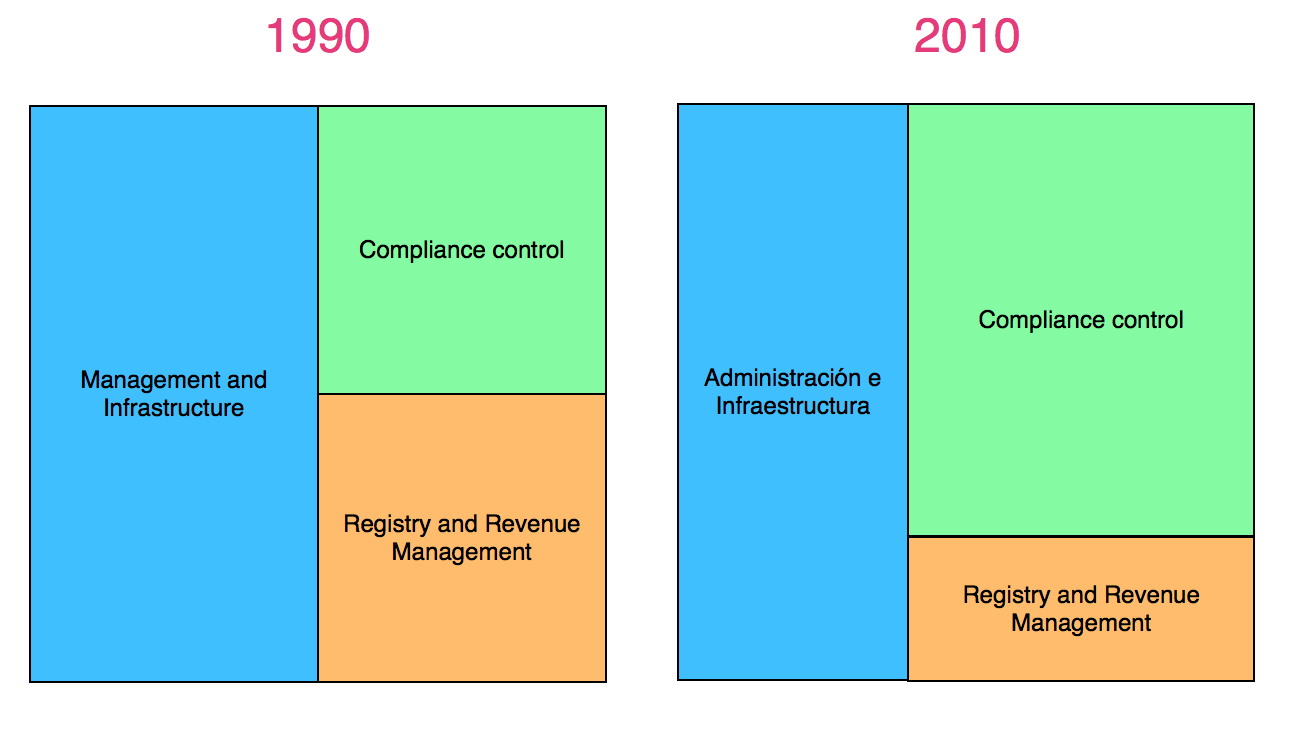
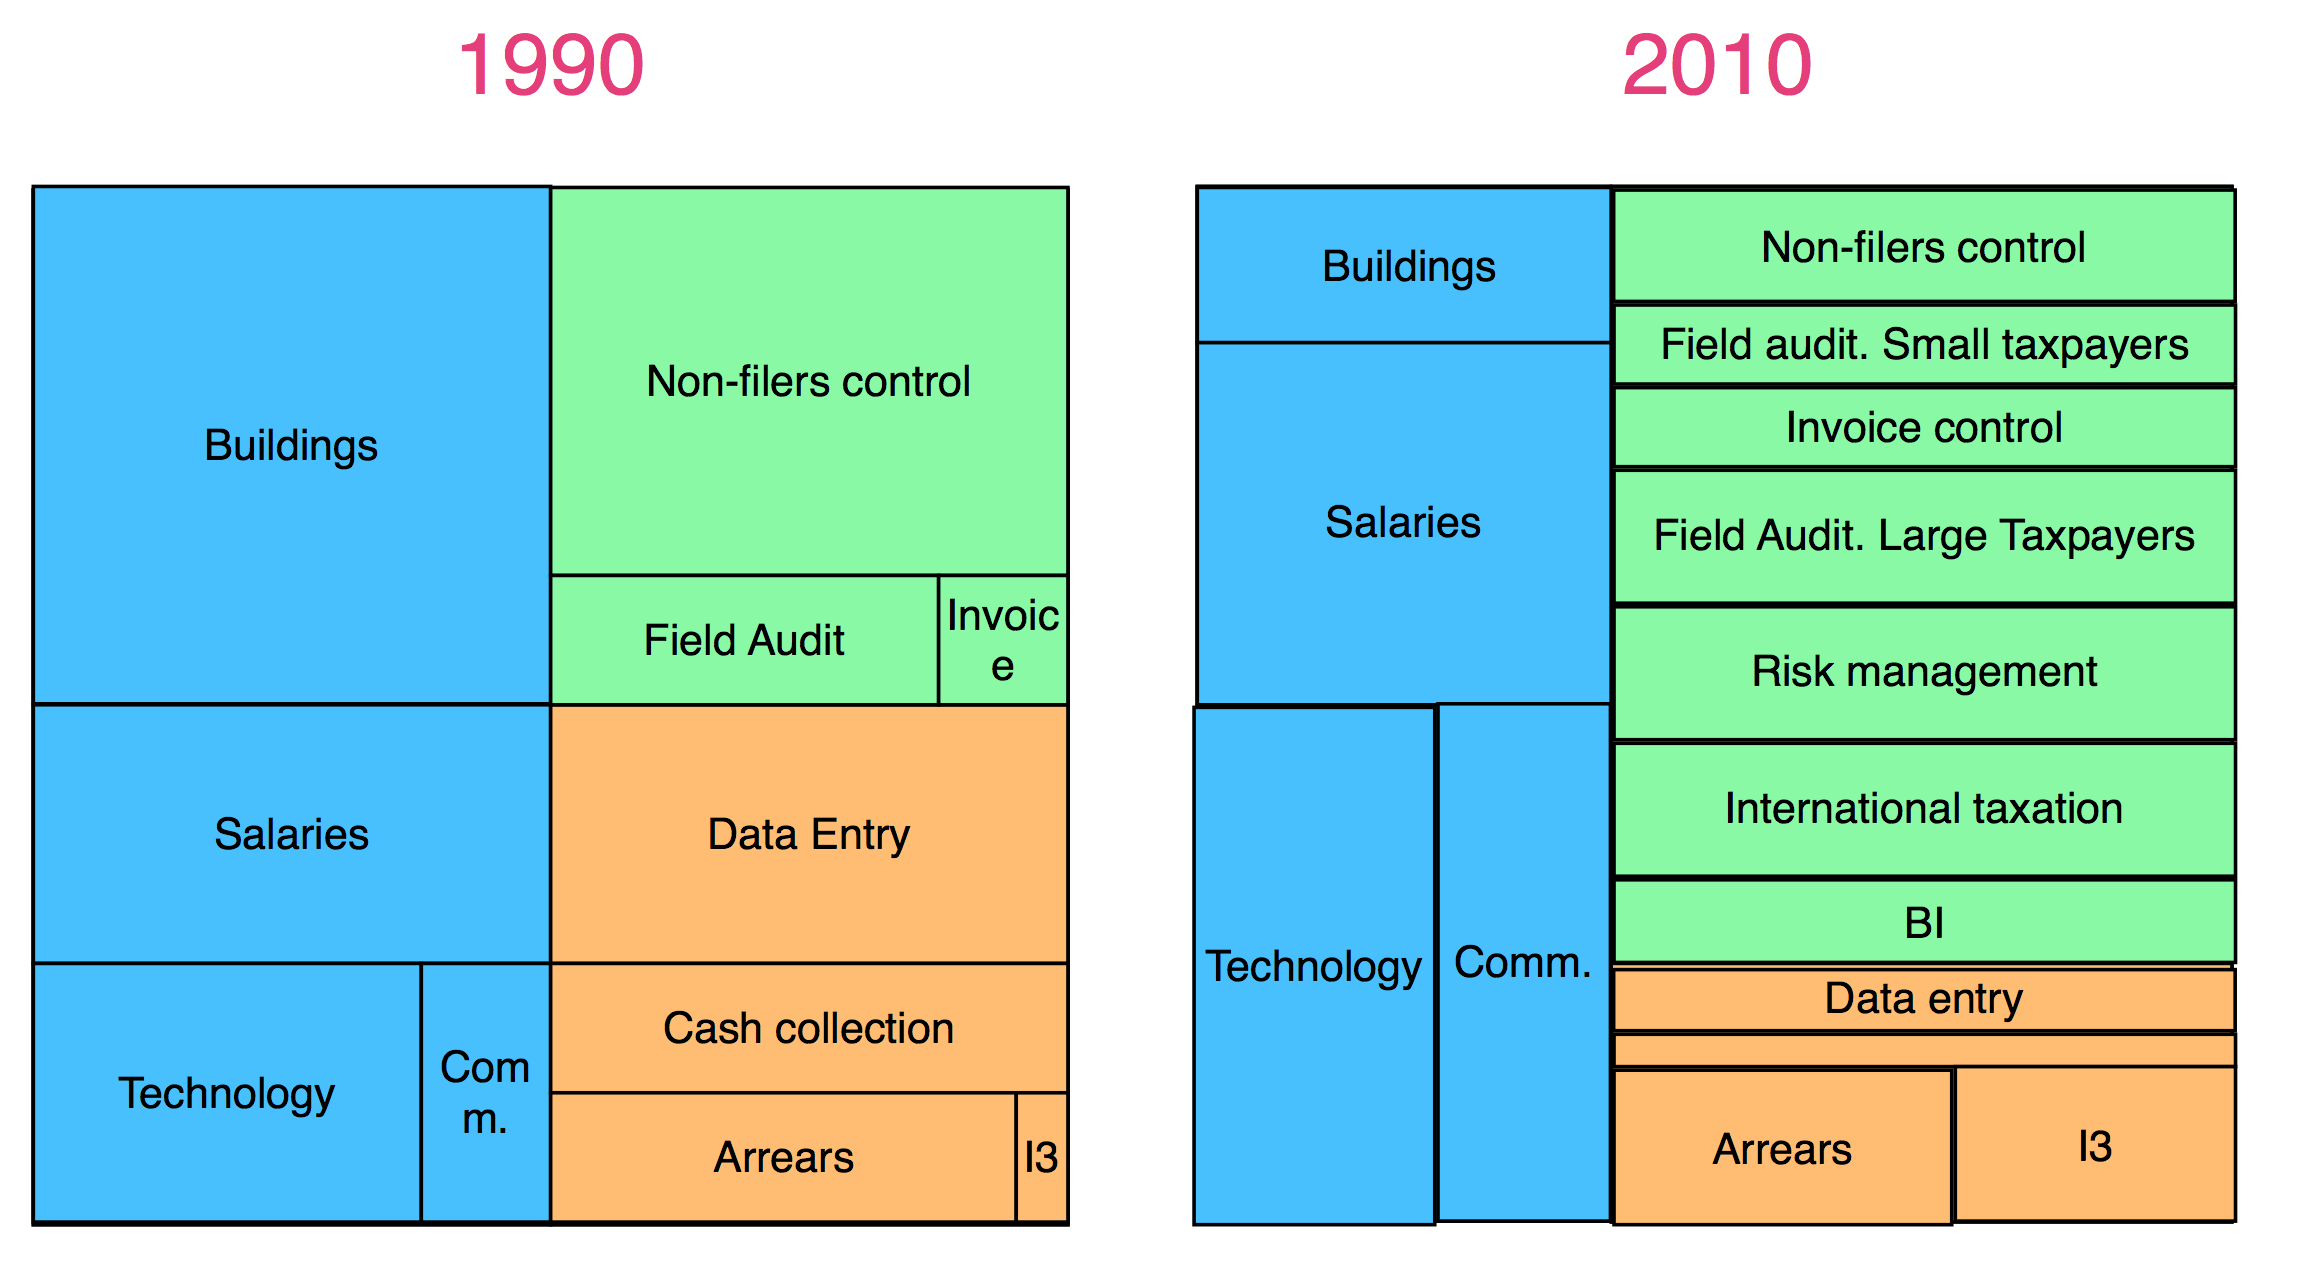
At greater aggregation levels, the costs would be separated in three categories: 1) registry and collection; 2) compliance control; and 3) infrastructure and management. Each category will include the payroll cost for each area, the training and the specific or prorated technological investments. At lower levels it would be possible to consider other aspects, such as: attention platform in agencies, collection cost, address validation, identification of changes or bankruptcy in legal entities, processing returns, customer service, delivery of letters and reminders, notifications. For the control area the topics could be the control of return submission, the control of the payments, the audits, field audits to large taxpayers, exchange of information with other tax administrations, massive programs of book control and invoicing, etc. What do you think?
Here is a pair of hypothetical diagrams showing the evolution in expenses and investments between 1990 and 2010. The relative importance of data entry, through large digital centers, would lose that importance in the 2010 composition; cash collection would disappear, in contrast a space for customer service management would be created; the relative importance of obtaining of third party data would be growing. On the other hand, in administrative and infrastructure expenses the relative participation of investments in information and communications technologies increase. Meanwhile, within the compliance control areas new categories appear, such as audit of large taxpayers, risk management, international taxation and studies based on business intelligence and data mining.
Greetings and good luck
1,700 total views, 1 views today