A brief summary of the World Bank’s Carbon Pricing Report 2023
The World Bank report State and Trends in Carbon Pricing 2023 [1] provides an up-to-date overview of existing and emerging carbon pricing instruments around the world. It also explores the trends of these instruments, including carbon taxes, carbon credit mechanisms and ETS emissions trading systems. According to the report, carbon pricing must continue to grow, in price and coverage, to drive global climate action and meet the goals of the Paris Agreement.
In the midst of the global energy crisis and economic problems, revenues from carbon credits negotiated in emissions trading systems (ETS) and carbon taxes reached a record high in 2022, reaching almost 100 billion.
“The Carbon pricing it is an essential policy tool to decarbonize the world economies. Through various instruments, carbon prices provide economic incentives to make climate-friendly changes in consumption, production and investment”[2]. The intense heat waves of the summer of 2023, recorded as the hottest year in climate history, they will probably play an important role in the next evolutions of carbon pricing policies.
Carbon prices slowed down in 2022 but are still growing.
After years of high growth, in 2022 carbon prices have slowed down. They have overcome the global energy crisis of 2022, and even half of the prices of instruments increased. The ETS of the European Union, linked to the Swiss regime, registered the largest increases, with price reaching 100 Euros for the first time. In other ETS, carbon prices were reduced by up to 35%, as in the case of the Republic of Korea’s ETS. About a third have the same prices, while less than 15% declined. UK’s carbon prices, long remaining linked to the European system, have now slightly diverged.
“Most instruments in high-income countries have prices above USD 50, and nearly all above USD 15. In middle-income countries most instruments have prices below USD 10. There are, though, several examples of instruments in middle-income countries with prices above USD 10, such as in the Beijing and Guangdong ETS Pilots (in China), the carbon tax of Latvia, and the subnational carbon taxes in Mexico (Querétaro, Yucatán, and Zacatecas).”
Other countries decided to strengthen their ETS and carbon taxes in the coming years. For example, Singapore will increase the nation’s carbon tax from 2026, from From USD 4-34 to USD 38-60. Similarly, Canada is carrying out its plan to increase its federal baseline to review USD 127 by 2030.
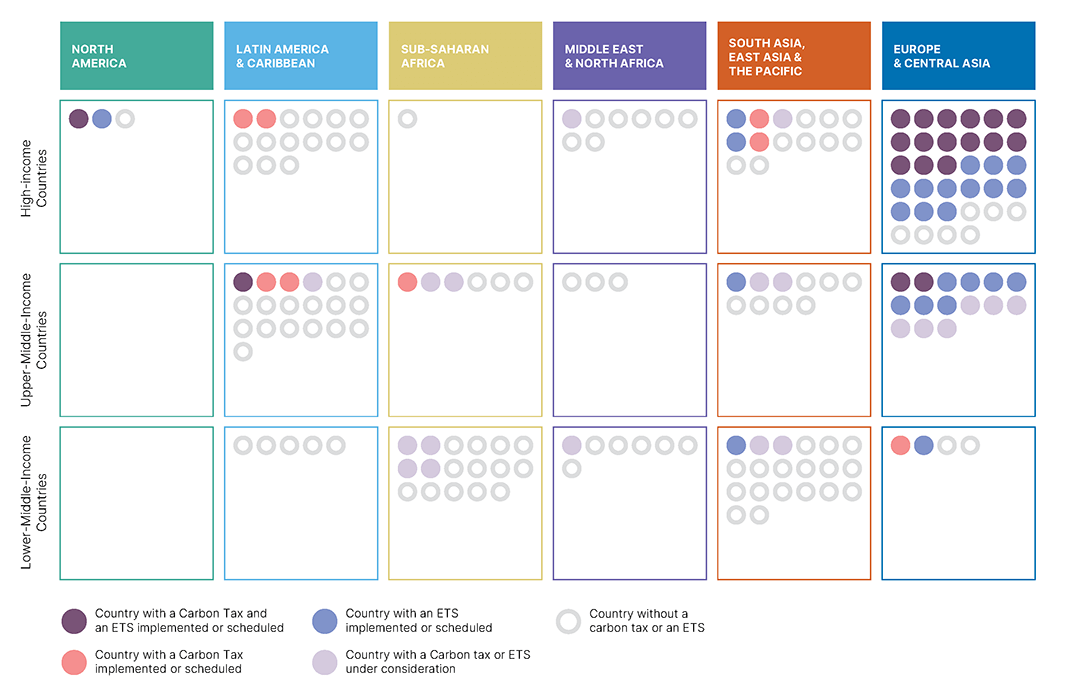
Graphs source: World Bank Although the number of adopted ETSs and carbon taxes has slightly increased to 73, as of April 2023, most of them are still being introduced in Europe.
Apart from policy changes, energy markets and drought were some of the main factors affecting carbon prices in most ETS. The carbon prices have to grow in the long term to drive investments at the necessary scale and pace. To keep global warming below 2°C, prices must reach $50/tCO2 to $100/tCO2 by 2030.
As of April 2023, less than 5% of global GHG emissions are covered by a direct carbon price equal to or higher than the suggested range for 2030 (in 2023 US dollar value). Most of these high-priced carbon pricing instruments are located in European countries. The following map refer to both ETS prices and carbon taxes, with darker tones representing higher prices. The increase is mainly occurring in countries that are already pricing carbon, referring to the map below
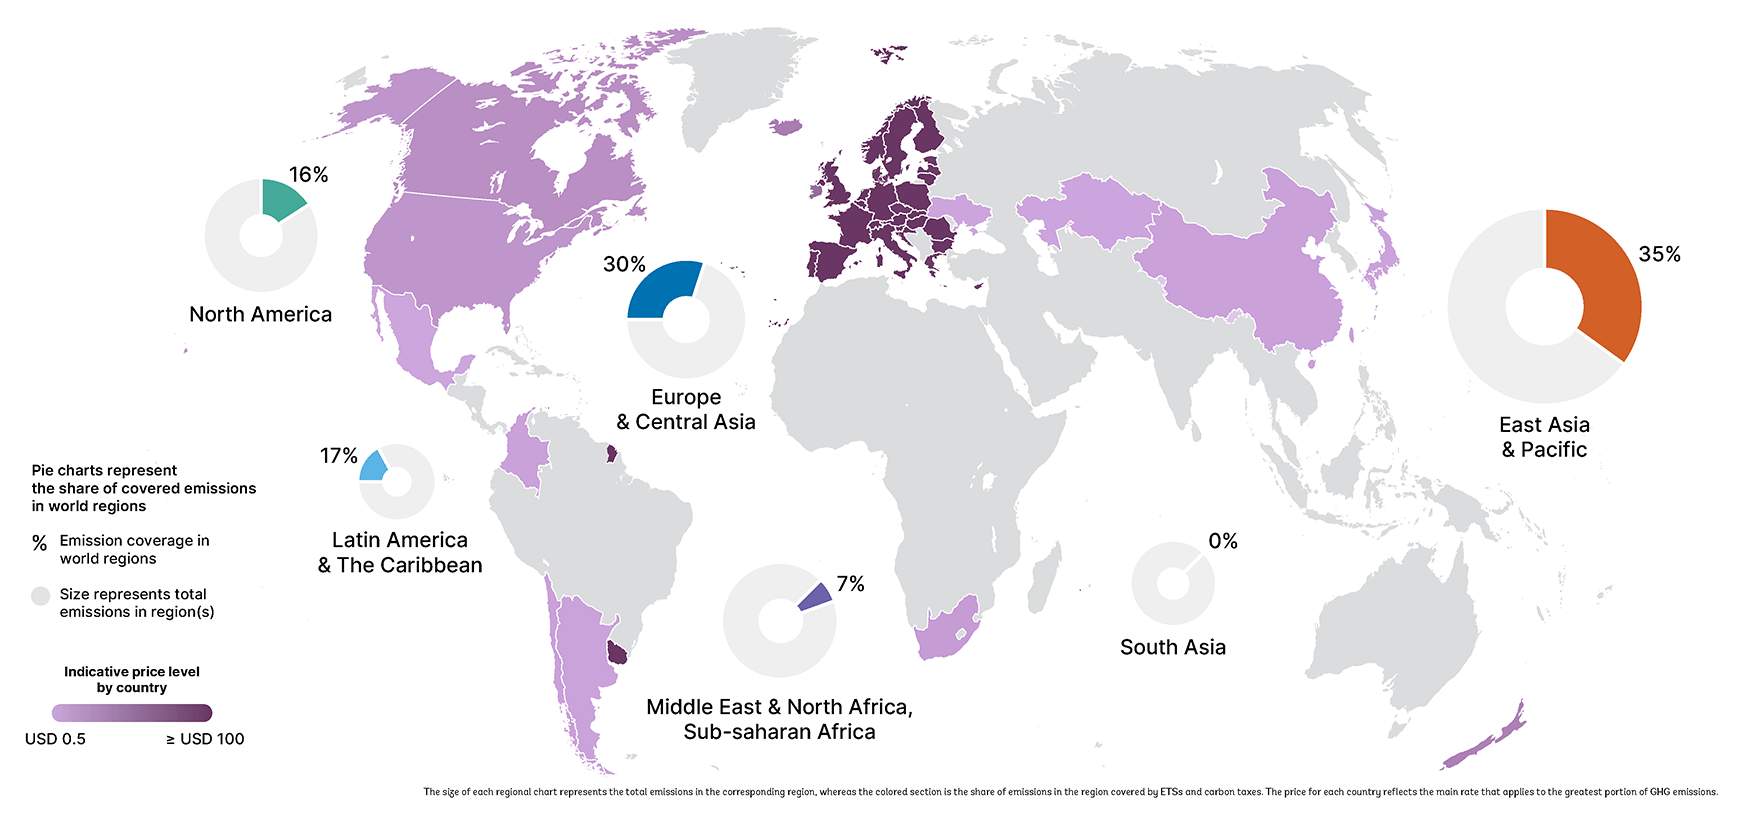
MAP OF THE CARBON PRICE LEVELS AND THE COVERAGE OF THE APPLIED CARBON TAXES AND ETS. Pie charts represent the percentage of emissions covered Graphs source: World Bank
Most carbon taxes cover fossil fuels, while ETS tend to focus on large industrial facilities
In 2022, several jurisdictions complied with their existing plans for new ETS or carbon taxes, or increased their ambition, with some new proposals to develop new carbon pricing initiatives. In general, the small increase in carbon instruments in operation covers approximately 23% of global carbon emissions. This increase represents an increase of 1% with respect to the previous year. Emerging economies are showing increasing interest in adopting carbon credit instruments, but high-income nations still dominate the global market.
Carbon pricing mechanisms currently focus on energy and industrial emissions. Most carbon taxes cover certain fossil fuels used in different sectors, while ETS often focus on large industrial facilities. Other countries are also considering the creation of future ETS such as Malaysia, Vietnam and Thailand. Taiwan and China passed a law earlier this year to introduce a carbon tax on big emitters. In Latin America, Colombia and Chile slightly increased their taxation of carbon emissions and Colombia is considering a law to compensate victims of displacement due to the climate emergencies. In Brazil, a national cap and trade legislation is announced in 2023.
Carbon pricing revenues reached almost 100 billion (USD)
A highlight of the report, total carbon revenues from ETS and taxes increased from 10% in 2022, reaching 995 billion, an increase of 10 billion. Carbon revenues are the product of carbon pricing, the specific emissions covered and other pricing design factors such as rebates, dividends and allocation methods.
Revenues in the European Union (EU ETS) have increased 7x since 2017, generating a total of $42 billion in 2022. The increase of $7.8 billion account for more than 76% of the total increase in global carbon pricing revenues. This is partly due to the higher prices, but also due to the shift from the carbon emission allowance-free allocation to the auction.
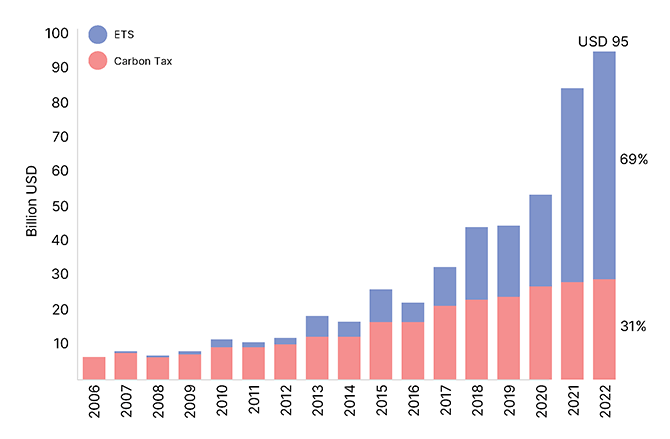
Evolution of global revenues by type of carbon price: ETS (blue) or carbon tax (pink) Graphs source: World Bank
In 2022, the ETS represented approximately 69% of government revenues from direct carbon prices, while carbon taxes took the rest, 31%. As for how governments spend carbon revenues, it is estimated that on average 46% of revenues are allocated to specific policies, 29% to the general budget, 10% to direct transfers and 9% to tax reductions.
Based on renewable Energy or based on natural solutions, carbon markets diversify.
After 2 years of strong growth, the carbon credit markets slowed down last year, with a slight decline starting in 2021. A total of 196 million of carbon credits were retired in 2022. The supply of new carbon credits and demand from end users decreased slightly. Independent accreditation mechanisms or voluntary carbon markets provide most of the credits. But credit emissions from international mechanisms such as the Clean Development Mechanism (CDM) grew in 2022, representing 30% of the total issued.
The voluntary corporate use of carbon credits remains the main source of demand in the market. In addition, more and more nations are thinking about establishing their own carbon credit mechanisms. This plan is often combined with a carbon tax or ETS policy. For example, New Zealand it will be the first country in the world to put a price on agricultural emissions by 2025, independently of its existing ETS.
Renewable energy continues to dominate the carbon markets. The share of carbon credits generated by renewable energy activities has increased since 2018; it represents about 45% of the registered projects and represent 55% of credits issued in 2022. In terms of carbon credits withdrawn last year, 52% they came from renewable energy projects, compared to 44% in 2021. Renewable energy credits (REC) are still widely available and are among the types of credit least expensive.
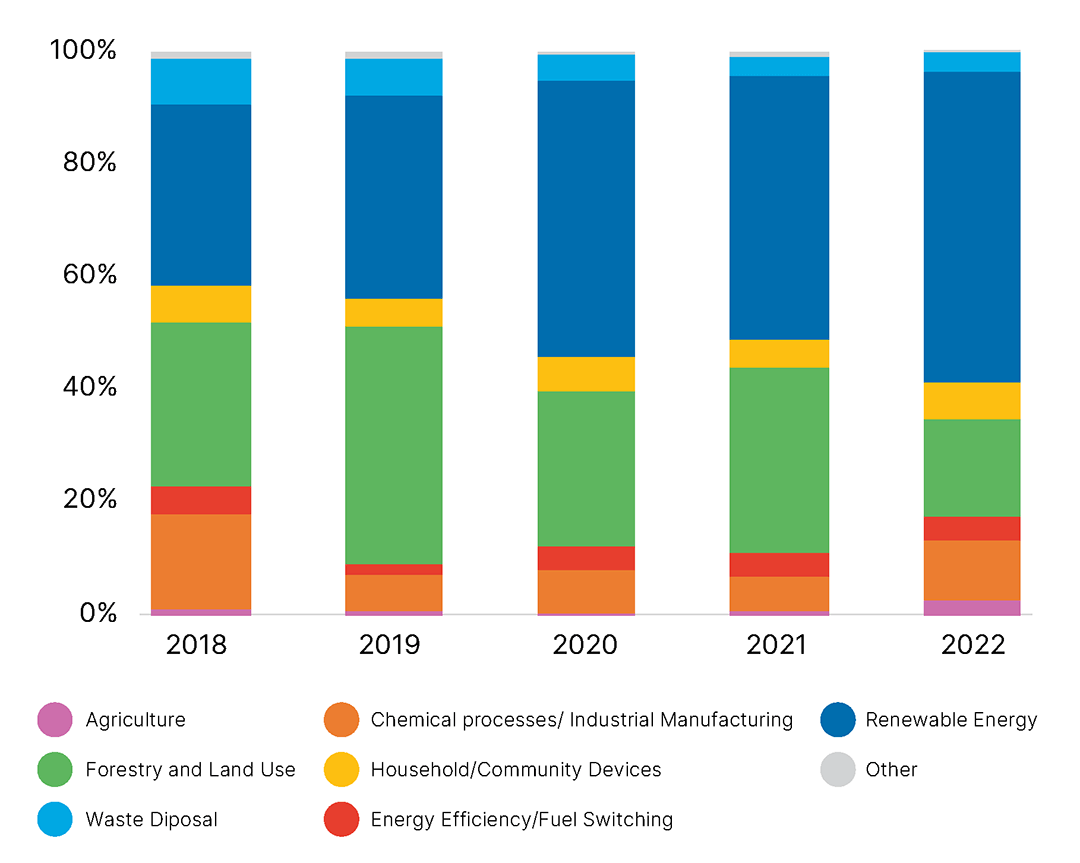
PERCENTAGE OF TOTAL ISSUANCE BY PROJECT CATEGORY AND YEAR
As the cost of renewable energy has decreased significantly in the last 10 years, ER projects may no longer need the additional revenue from carbon credits, therefore, this supply of carbon credits from large ER projects will probably decrease over time.
Instead, there has been an increasing focus on nature-based activities. These include projects involving emissions reductions from agriculture and forestry and land use. The credits they produce often offer co-benefits, other socio-economic benefits besides carbon reduction, valued by many buyers. Carbon credit markets can support forest preservation by providing emission reductions by reducing deforestation and forest degradation, as well as improving forest management (referred to as REDD+).
Although credit emissions from forestry and land-use activities decreased in 2022, this may change soon, according to industry experts. Last year, 54% of the new registered projects were for nature-based solutions, potential for expansion of the supply in the future, and is very applicable in Latin American countries, since for example, Brazil’s forestry and conservation policies changed a lot in 2023, and several countries in this region adopted new climate plans, such as Colombia and Chile. As it grows in diversity and complexity, it is hoped that the carbon credit market will also mature in transparency and global standards.
Diversity of mitigation policies
National and sub-national governments continue to implement direct carbon pricing instruments with a number of different policy design specifications, reflecting different political, institutional, legal and administrative environments. Governments also continue to apply indirect carbon pricing in the form of excise taxes on fossil fuels and subsidies worth more than $1 trillion each year, which influence the underlying incentive, although they are not mainly adopted as a climate change mitigation policy; likewise, fossil fuel subsidies still exist in many countries, hindering the taxation of carbon emissions.
This highlights the increasing complexity of tracking trends in carbon pricing and underscores the increasing importance of understanding how advances in direct carbon pricing interact with indirect pricing and with other policies to achieve broader climate and policy objectives. It also underlines the importance of closing data gaps to ensure that policymakers and other stakeholders have up-to-date information on how carbon pricing is being implemented, a task the World Bank promises to continue to do.
While the world suffers from increasing heat waves, critical ecosystems and marine currents are severely affected by climate change, causing increasingly grave threats, and the taxation of air pollution represents an important part of the solutions, but its growth is still far too slow, compared to the urgency of the collective action required to slow down the rise in global temperatures.
[1] World Bank “State and trends of carbon pricing 2023”, is the source of the graphs and can be downloaded at https://openknowledge.worldbank.org/entities/publication/58f2a409-9bb7-4ee6-899d-be47835c838f
[2] See Also https://carboncredits.com/6-key-takeaways-from-world-bank-2023-carbon-pricing-report/
60,599 total views, 18 views today
1 comment
Hi Dear,
The World Bank’s Carbon Pricing Report provides crucial insights into tackling climate change. It’s great to see comprehensive analysis and strategies for carbon pricing. A valuable resource for a sustainable future. We are also a blogger read more at bbcworldinfo. Thanks!