Progressive, regressive, or neutral tax systems: their current international relevance

Introduction
The financing of public spending is a high-priority economic issue that sparks debate in the theoretical field, given the diverse positions that have been formulated by universities, research centers, international organizations, political parties, business associations, trade unions, etc.
In this post, the focus is on tax revenues, without ignoring the importance of non-tax public revenues (business, concessions, exploitation of natural resources, sales of the public domain, etc.) and indebtedness, to which many countries turn to supplement their financing[1].
Tax Models
What is the prevailing tax model? Is it uniform or dissimilar at the international level? What is the current debate on the matter?
To answer these questions, it should first be noted that there are two tax models: the theoretical model (based on taxes in force) and the effective model (based on taxes collected).
As for the theoretical model, the adoption of an orthodox model based on direct taxation (income and wealth taxation[2]) and in indirect taxation (general and specific consumption taxation) is clearly emerging, with some complementary heterodox tax[3].
By contrast, the effective model is based on the tax collection and the importance of each type of taxation in tax revenues. In this case, the model can be progressive (greater incidence of direct taxation), regressive (indirect taxation) or neutral (equalization).
Tax Pressure
Regarding the tax pressure at the international level, the following is observed:
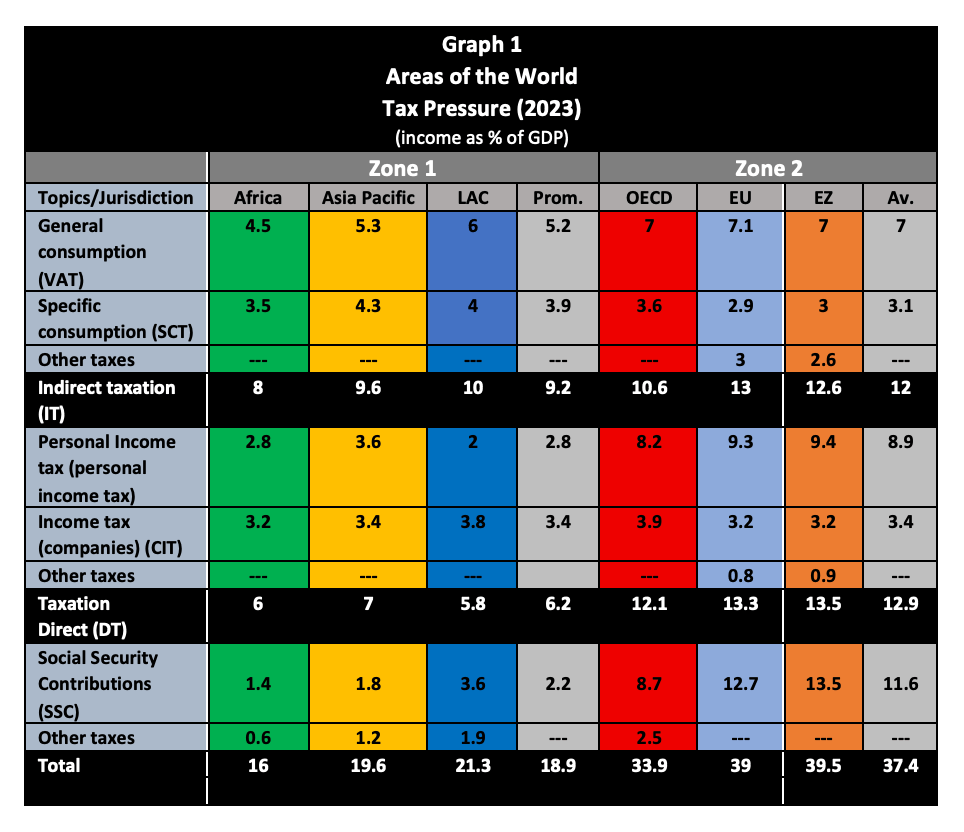
Source: OECD (2025)[4], European Commission EC (2025)[5], Tax Statistics in Latin America and the Caribbean (2025) OECD, CIAT, IDB, ECLAC[6].
Other taxes: The OECD and the EC apply different calculation methodology. The former identifies them separately, and the latter includes them according to their nature in direct or indirect taxation.
In Zone 1, the one with the lowest degree of economic development, the tax systems applied are mostly regressive, with a gap between indirect and direct taxation averaging 3% of GDP (2% in Africa, 2.6% in Asia Pacific and 4.2% of GDP in AL).
Zone 2, where the most economically developed countries are located, has a neutral average tax pressure, since the
With regard to social security contributions, there is a marked difference of five times the tax pressure between Zone 2 (11.6% of GDP) and Zone 1 (2.2% of GDP), a situation that ultimately affects its financing and, therefore, the level of social benefits, with a strong impact on social inclusion and cohesion.
Tax Structure
As for the tax structure, the following data are observed:
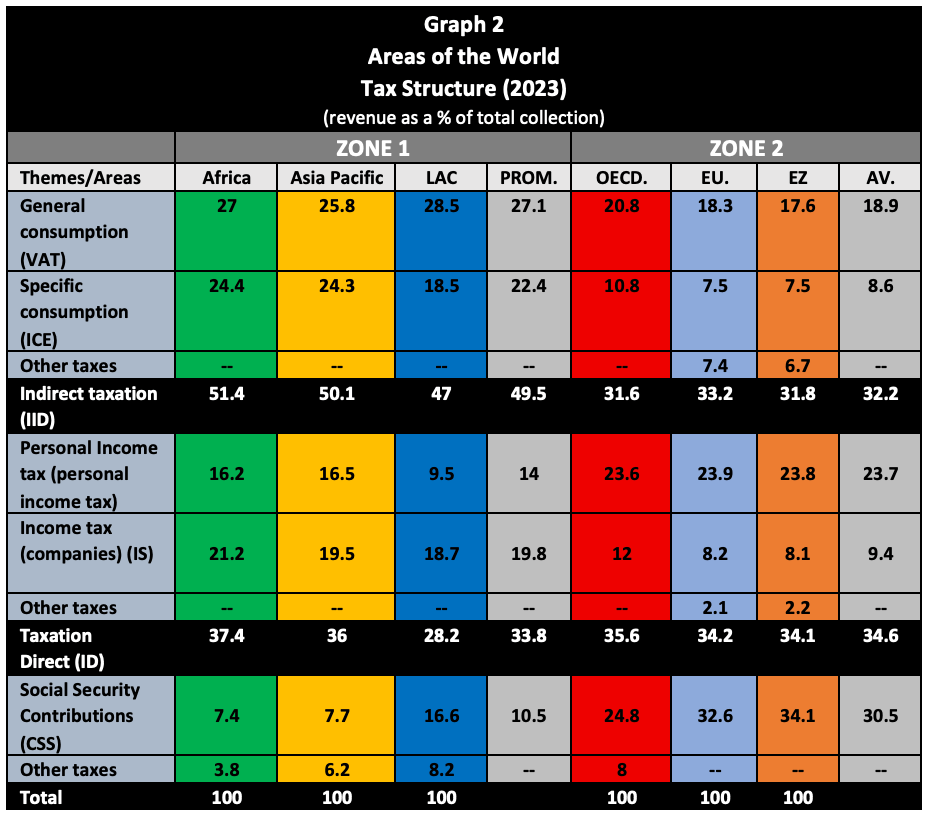
Source: See references in Figure 1.
Zone 1 on average has a regressive tax collection system, that is, with the prevalence of indirect taxation over direct taxation of 15.7% (Africa of 14%, Asia Pacific of 14.1% and LAC of 18.8%).
In Zone 2, there is a neutral tax system with a minimal difference in the percentage of income in favor of direct taxes (OECD of 4%, the EU of 1% and the Eurozone of 2.3%).
With regard to social security resources, both areas have significantly unequal revenues in terms of total collection, with Zone 1 averaging 10.5% (Africa 7.4%, Asia-Pacific 7.7%, and LAC 16.6%), while Zone 2, with 30.5% of revenue, exceeds it by three times (OECD 24.8%, EU 32.6%, and Eurozone 34.1%).
Summary:
In summary, the following can be highlighted:
1) Tax System: Zone 1 (Africa, Asia Pacific, and LAC) has a regressive TS based on consumption taxation, while Zone 2 (OECD, EU, and the EZ) has a mainly neutral system.
2) Consumption tax: The level of tax pressure is somewhat similar in both areas.
3) Income tax applicable to individuals: There are significant differences, in that while Zone 2 (OECD, EU, and EZ) has an average tax burden of 8.9% of GDP and 23.7% of revenue, Zone 1 (Africa, Asia-Pacific, and Latin America) averages only 2.8% of GDP and 14% of total revenue.
4) Taxation of corporate income: both areas have the same tax burden (3.4%)[7].
5) Social Security contributions: Another significant difference of three times the revenue is found in this area, as Zone 2 (OECD, EU, and EZ) collects an average of 30.5% of total revenue, while the revenue in Zone 1 (Africa, Asia-Pacific, and Latin America) barely reaches 10.5%.
Conclusion
While historically debates on this issue were between supporters of a progressive system and advocates of a regressive system, each with their different economic and social rationales, today, based on the current tax reality, the focus of the discussion has shifted to the debate between a neutral tax system and a regressive tax system.
It can be observed that the most economically developed countries tend to have neutral systems, with a high level of social security and income tax contributions for individuals, and lower tax pressure on companies, with the aim of attracting investment to their territories and/or preventing the relocation of such investment in a world of intense economic competition.
In contrast, emerging economies adhere to regressive tax systems, with prominent levels of consumption tax and low levels of personal income tax, but with the additional support of non-tax revenue and debt to finance their public spending.
References:
[1] Without ignoring the effects of the so-called “curse of natural resources”, that is, the paradox that countries with an abundance of natural resources often have lower economic development and worse social outcomes than countries with fewer resources.
[2] Global wealth taxation is minimal at the national level and is delegated in most countries to the subnational level.
[3] The long arm of heterodox taxation reaches where the short arm of orthodox taxation cannot reach. The Global Minimum Tax (OECD Pillar II) has recently been incorporated into this taxation.
[4] https://www.oecd.org/es/data/datasets/global-revenue-statistics-database.html#sources
[5]https://taxation-customs.ec.europa.eu/document/download/aff28bc9-f9dc-4665-8510-72224c9e1ea9_en?filename=Annex_A_FINAL.pdf
[6]https://www.oecd.org/es/publications/estadisticas-tributarias-en-america-latina-y-el-caribe-2025_f0bee3b4-es.html
[7] This is despite the fact that there is a difference in the aliquots between the zones, because while in Europe the average is 21.2 % (32 countries), in LA they are in 28.8% (18 countries).
18,800 total views, 9 views today