A million…
Let’s make it visible
 I have decided to publish this post for the following reasons:
- On September 26, in Quito, I presented a paper on the vision of the future use of information technology in the tax administration. At the end of my presentation, I insisted on the need for administrations, particularly for information services, to work on making the information highly visible. This, in my opinion is becoming more important when there is a lot of information available. Enrique Sánchez Blanco, from the Spanish tax agency told us in his speech in Nairobi that if information is not structured and one is not prepared to manage it, can result in such volumes that it becomes impossible to handle. If we cannot deal with it we might end up, as I wrote in a previous blog, about my friend Dario and his problem of rabbits.
- At that same seminar, which was about “Models of integrated management and innovation for the tax Administration”, Mauro Andino Sri ended his speech talking about development and new future technology services considered in tax administration. The slide that supported his presentation included two concepts: social networks and big data.
- During this time, more than once I asked myself how we would feel when things don’t work as they used to in the past. When this happens, you may feel that you are getting older, as when you need glasses to read better.
- This Blog, CIATalk next week will most probably reach one million visits. To reach this memorable number, I was wondering: If you had to write it in letters, as I did; or with digits, 1,000,000; or use other forms of representation 10 6; or 1M; or, perhaps, a bar [1]. Different ways of representing, perhaps even visualize, the same number. Depending on the reader, one of these forms can make more sense than other.
- One million accesses to CIATalk reminded me of Roberto Carlos’ song “I would like to have a million friends”. I wondered how to visualize a million friends. I thought about my friends, that I have on Facebook who are a thousand times less than a million, and yet it is very difficult to see them all.
The picture below helps to visualize my friends on Facebook. Each node is a person; each segment represents a friendship between their ends:
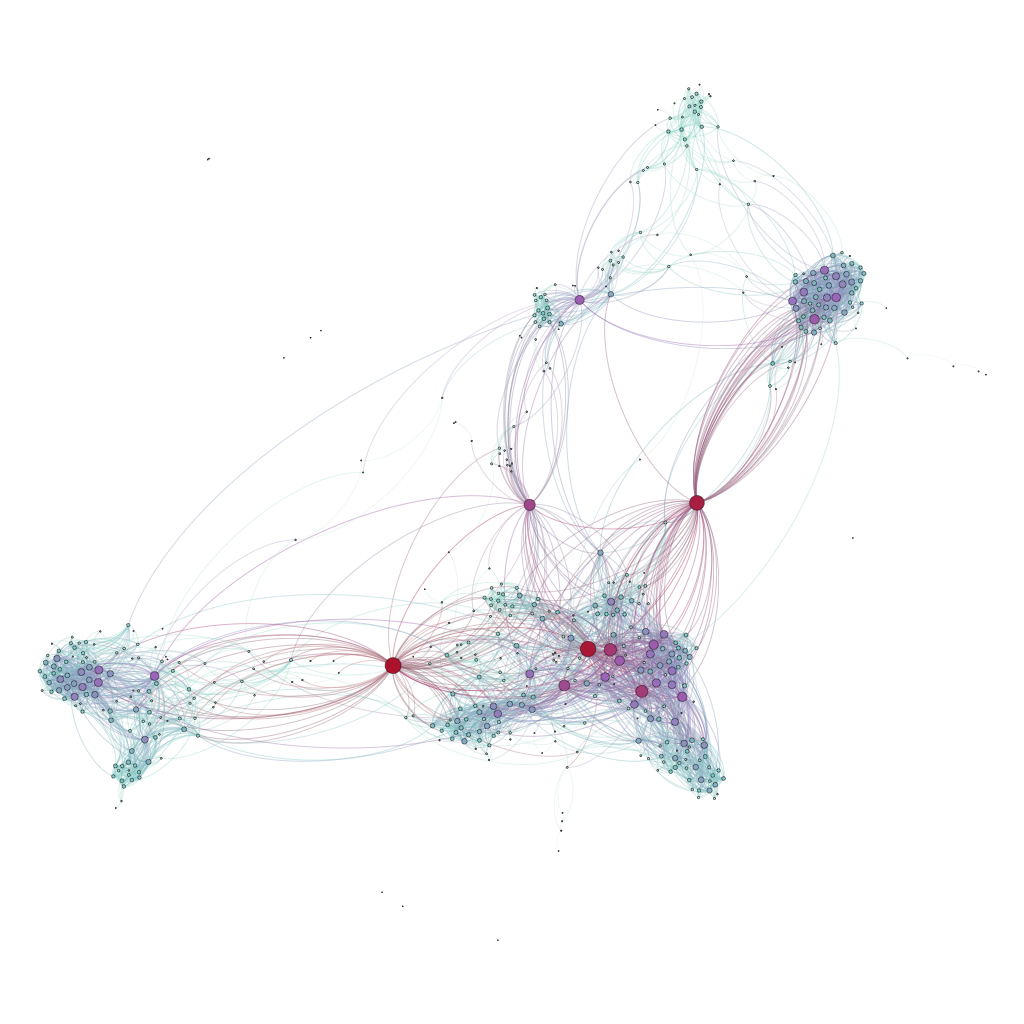
I am not on the graph. If I were, there would a line connecting all nodes: my friends. Each node in the graph would have at least one line. It is, so to say, a graph of my friends, but without me.
There are some nodes that represent people who have their own friends, and who do not have other friends in common with me. They are usually friends who live in an exotic country, or some old friend who might prefer not to remember my name today.
Towards the center we see a big web, which connects all other nodes. Some move to the periphery, with one or a couple of links, which are mutual friends. Towards the center there is a dense web of nodes and lines. The size of each node represents the volume of that node, i.e. the number of friends within this network, and the larger the node, the greater the number of common friends.
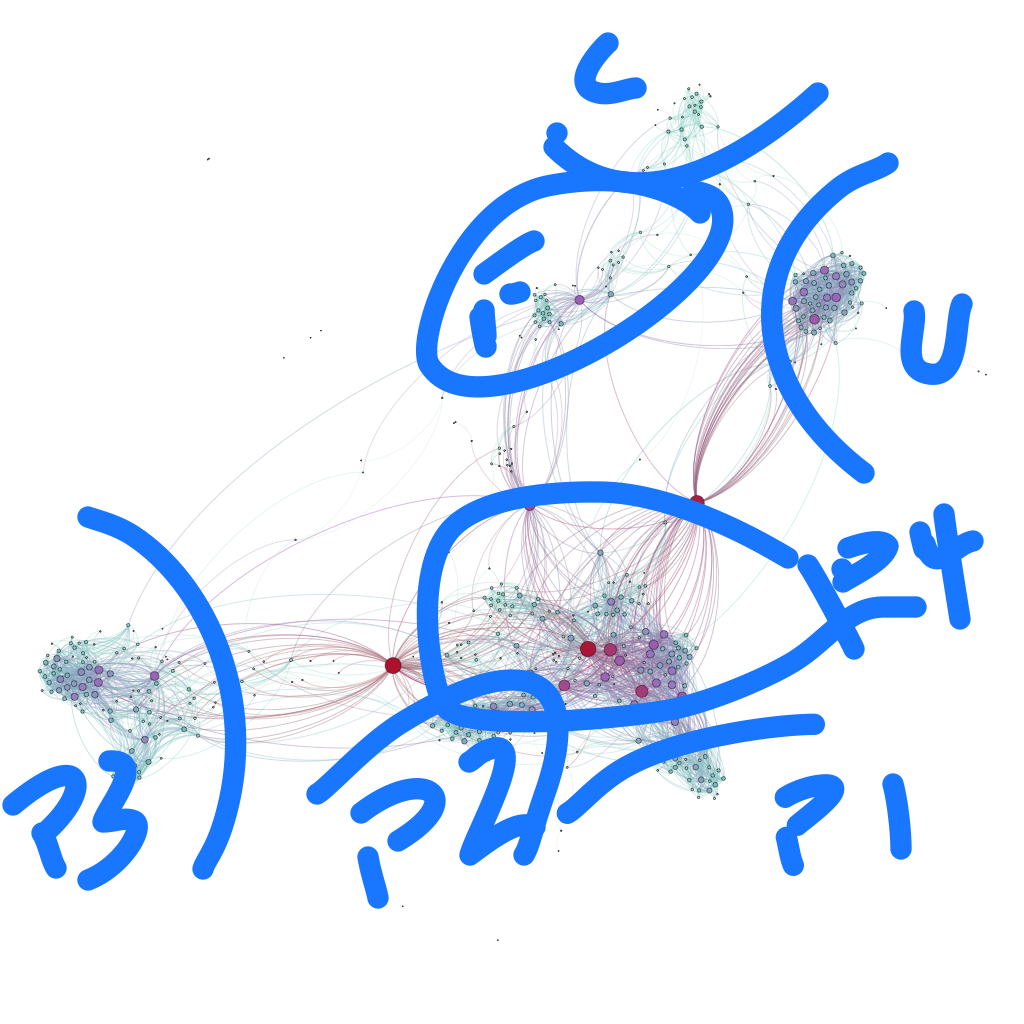
Common friendships are grouped, looking like grapevines. The diagram below illustrates the sub-groups. Group C represents mainly my school friends. U is the University; F is those related to my family and people I know through my family, the P1 to P4 are friends made during my life in a country. The P3, older than the others, has two clusters. The biggest represents friendships related to work. The other, smaller, is related to friendships with other cultural, sporting and …mmm… personal activities.
Some nodes large in size are in the middle of two or more clusters of friends. It doesn’t mean that they are connecting two groups. It rather means that are part of two or more groups.
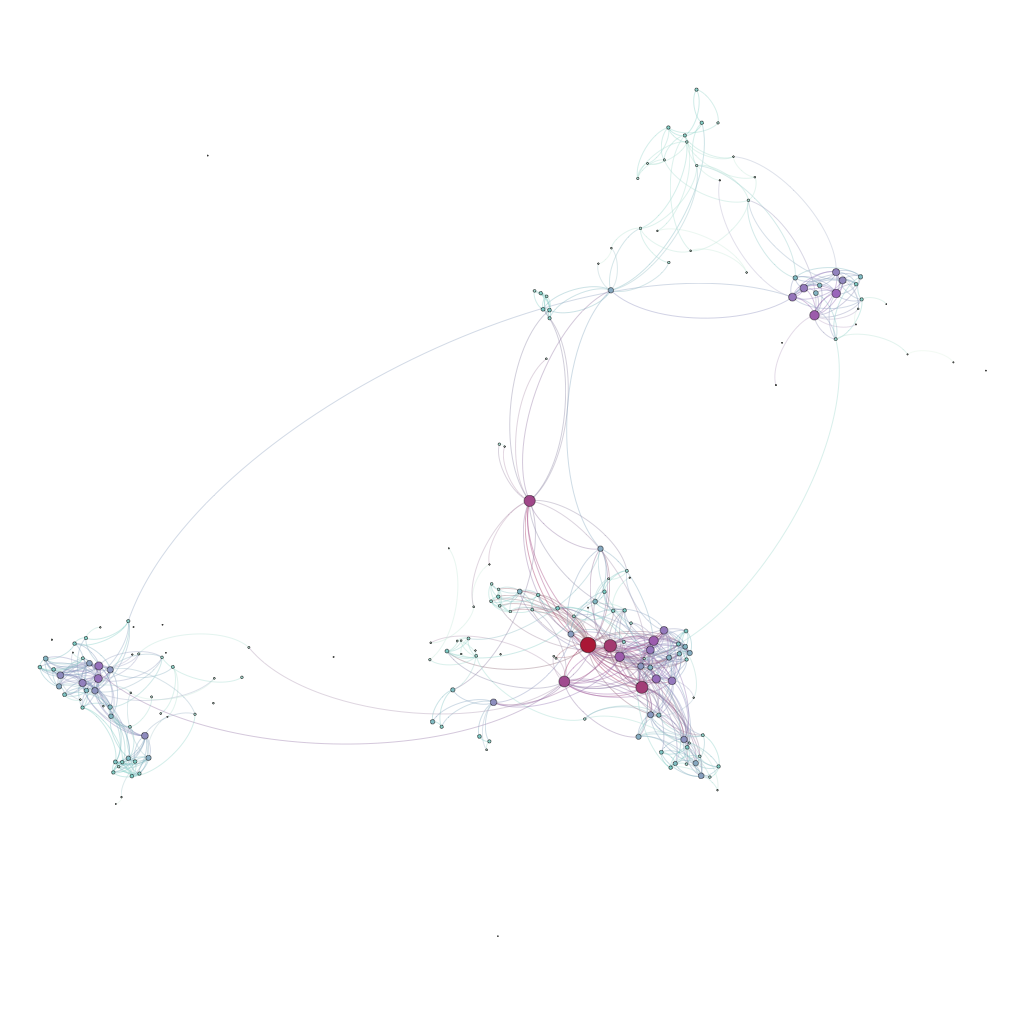
I wondered if all nodes are equally important in the field of Facebook. Certainly in the network, not all users are equally active. The diagram below identifies the nodes of those active in the network. Some nodes match the larger dots. They are very active, post a lot, and have many friends in common. But not all are alike. If I wanted to spread a message to my friends more quickly, we can clearly identify who should be contacted.
Now, I wonder and would like to ask you. Doesn’t this look like the network of, for example, large taxpayers, where line segments represent the purchase or sale transactions between them, or the existence of a director, an accountant or a partner in common, or those conducting transactions subject to transfer pricing? And if instead of filtering the graph through Facebook activity, it was filtered by the transactions volume or value? What are the major nodes? What are the nodes in the middle of the cluster? Are the groups formed, as in my case, according to the place or time, or do they meet other criteria: economic, productive or, who knows, tax-related?
Greetings and good luck
( 1) A million in Argentinian lunfardo
1,707 total views, 4 views today