A very, very simple example on the use of Artificial Intelligence in Tax Administration

Very often we hear, read, or see reports, announcements, or news about the application of artificial intelligence, and particularly machine learning – to solve problems or make your solution more efficient.
The tax administration, of course, can also benefit from the application of these technologies to improve risk management, process large amounts of information in close to real-time, or to provide services and technical assistance with better levels of quality. And although this statement is very reasonable, in our opinion, it may still be in a somewhat abstract area. Some people, perhaps, will want to ask a question by hearing that previous statement: “ok, but how?”.
Precisely here we will try to answer with a simple, very simple, example of the power of artificial intelligence within the tax administration in different processes.
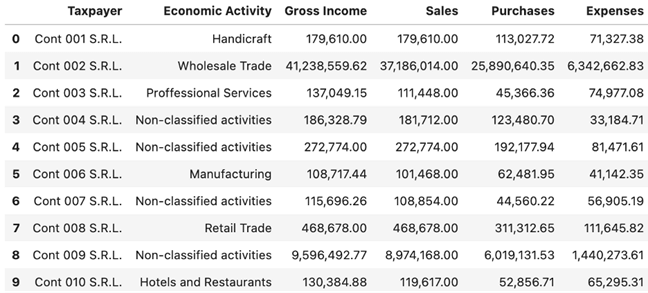
Let us assume that we are in an agency of a geographically located tax administration. This allows us to assume that there are not too many differences between taxpayers in the sense that, for example, some live in a developed area of a large city and others in a residential area or in a small inland population. This agency works with a thousand taxpayers. Our information on those taxpayers includes a few data from the registry and a few fields of their tax returns from the last financial year. Below, we see the first 10 records of these taxpayers.
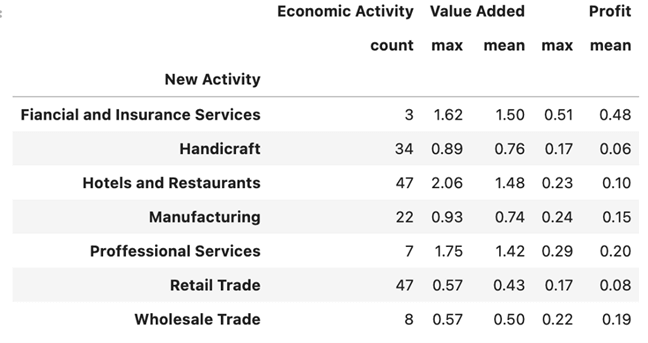
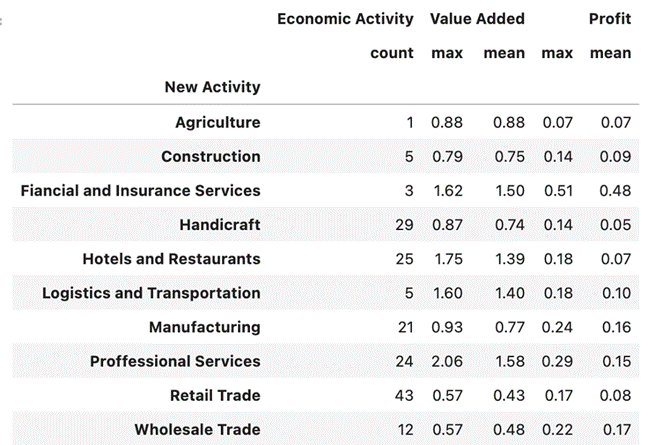
The following table allows us to evaluate, for each economic activity, the maximum values, and the average:
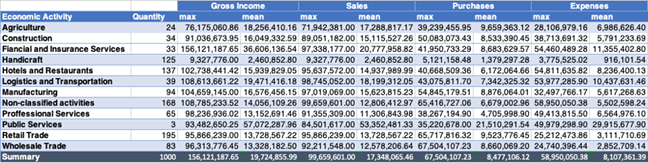
A quick review of the maximum and minimum values and the frequency distribution of economic activity allows us to observe that the number of taxpayers in the economic activity public services is very small (3), while notable in economic activities concerning retail trade, restaurants, and hotels, and those who are in other activities not classified. As for the average and maximum values it is observed that they are smaller for the crafts sector while they are higher in financial services and insurance.
To deepen our analysis of the data, we would study the distribution of values for each variable by economic activity, noting that for each variable the behavior is relatively similar in each economic activity, with values very close to all the quartiles in crafts and public services, and many values out of range – outliers – in other economic activities, but where we do not observe large differences in behavior.
Taking a step further we can add two calculated fields in our example. The first, also simplifying, we will call it Utility:

The second, we will call it Added Value,

The values of these two characteristics allow us to identify that the economic activity of the financial services and insurance includes the taxpayers who on average have the highest utility, while in the column of value added there is greater amplitude, with percentages ranging in average for the activity of more than 40% to almost 150%.
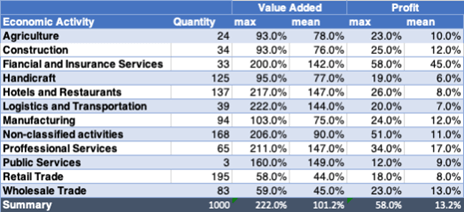
Each economic activity has a different distribution in the two variables, “other activities” being unclassified, the only category that has values out of range in utility, while the amplitude between quartiles in the case of added value is extremely remarkable. This leads us to think that taxpayers in this category have very dissimilar behavior.
If we graph each of the points corresponding to each of the thousand taxpayers with the coordinates of added value on the X-axis and utility on the Y-axis, we will have the following graph
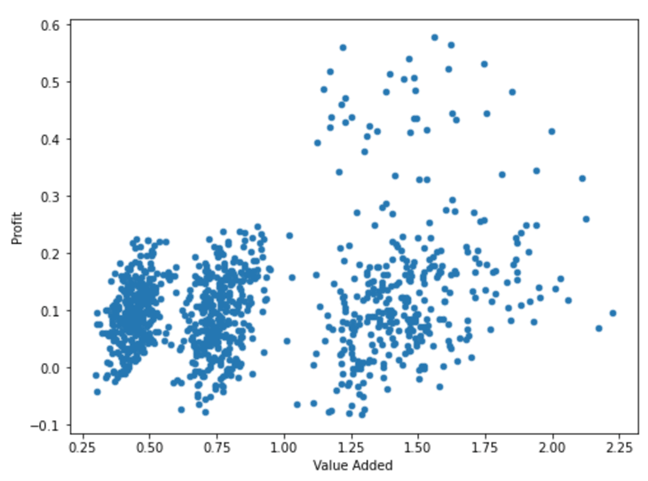
And artificial intelligence tools allow us to actually identify 4 groups of taxpayers, by their behavior:
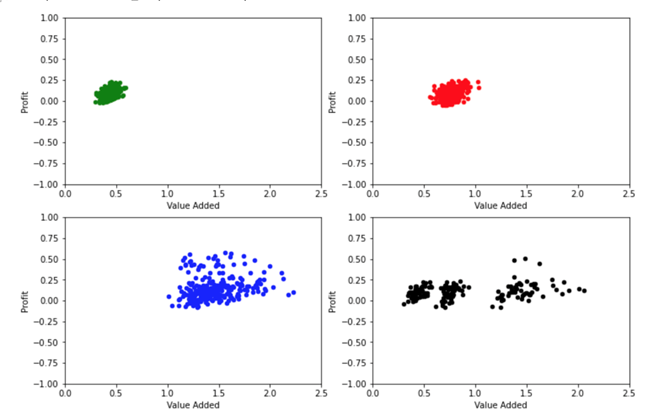
The first one corresponds to the economic activities wholesale trade and retail trade, painted in green. The second one shows the economic activities of agriculture, crafts, construction, and manufacturing industry; painted in red. The third one corresponds to restaurants and hotels, utilities, financial and insurance services, professional services, and transport and logistics, painted in blue. The fourth group, painted in black, corresponds to other unclassified activities, which has points in each of the above groups.
We can arbitrarily identify these groups as Trade, group 1. Processing of raw materials, group 2; Services, Group 3, and Not correctly classified, Group 0.
We find taxpayers with losses and profits in all groups, although the breadth of the ranges for trade is much smaller than for services. For added value, we clearly notice significant differences between the three groups, while unclassified taxpayers present a breadth of values that covers the entire spectrum of the other taxpayers. Our hypothesis is that these taxpayers actually have an economic activity corresponding to some of the activities identified in the other groups.
This is where we will use machine learning tools. In this case, we will use one of the simplest classification algorithms called “K nearest neighbors”, from a known population, the k nearest neighbors are determined and it is found that this point must correspond to the category that predominates among those majority points. That is, if for any point, most of the nearest points are of the trade type, the algorithm will determine that this is the category that corresponds to it, even if there are points of other categories. This can be illustrated by the following graph that would determine for our taxpayer population this division:
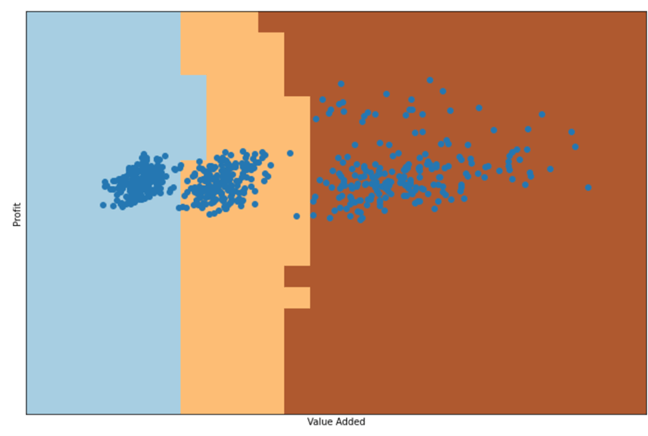
With this algorithm, any point that falls in the light blue zone will be classified as trade, in the cream zone as transformation and in the dark brown zone will be classified as services.
To train the algorithm and test its effectiveness, the set of 832 taxpayers with well-classified activities in a training group are randomly separated, in our case approximately 75%, as well as the test set (25%) to check the effectiveness of the algorithm. The effectiveness values of this algorithm with these divisions are 100% for the training set and 99% for the test set. This means that, if we apply it for the 168 taxpayers who are in the category of other unclassified activities, we could know quite accurately whether they are actually engaged in trade, transformation, or service activities.
This artificial division that I have completed here, although useful, does not cease to be arbitrary. We have the option to apply the same algorithm, not to identify which of these three aggregated sets of activities would correspond to each taxpayer with the unclassified economic activity, but to search for the economic activity itself. The following diagram illustrates how the algorithm would correspond
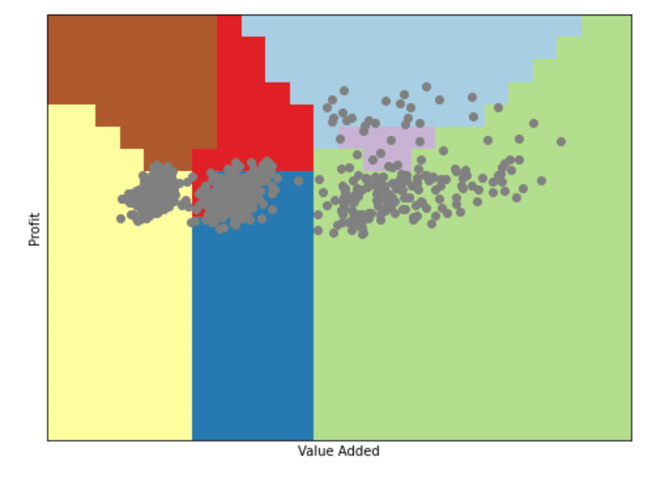
In this case, with the classification to the 10 economic activities identified, the effectiveness of our algorithm would be 67% for the training set and 65% for the test set.
These percentages of effectiveness are not as spectacular as those of the previous classification, but still, they leave us with a much greater probability than that of approaching the classification in a random way. More complex areas with possible overlaps are observed, as in the trade sectors on the left, with wholesale trade in blue and retail trade in green.
Applying this classification algorithm to the 168 taxpayers without correct classification of economic activity we would have the following distribution.
This result considers only the utility and value-added variables. A better approximation would come from performing the analysis using all 6 available variables and a more complex algorithm, one coming closer to our dataset. Although this is not as simple to visualize, since these would be in n dimensions. We will be using algorithms of a regression type called Logit for classification, (which in practical terms is to determine the probability that, in our case, they have a certain activity or not, the following activity or not, and so on) we would have a percentage of effectiveness of 83% for the training set and of 75% for the test set, which is much better than those observed in the previous example.
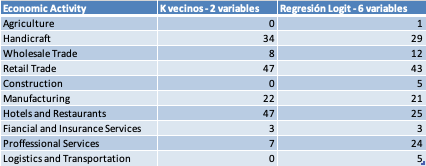
Applying this algorithm to the 168 taxpayers without proper classification, we would have the following distribution.
The use of machine learning tools allows us here, from the data available, to identify a possible real economic activity for the taxpayers who in this agency had a category of unclassified.
The example is illustrative for several reasons. A first conclusion is that there is no single machine learning algorithm that can be applied to our problem. On the contrary, there can be many, some suitable from existing methods and some to be created. In our example, as illustrated in the table below, the second algorithm used, more mathematically complex and with more data variables to contribute, does a better job.
In tax administration, we know that the correct identification of the economic activity of the taxpayer is important. It can be decisive in risk management, it can have implications in tax compliance, it can open spaces to specific benefits associated with an activity. This simple exercise, in our hypothetical agency, has allowed us in an extremely short time to assign a probable economic activity to 168 unclassified taxpayers. Only from the available data, without contacting the taxpayers. A traditional mechanism would surely have required a little more than a couple of person-months to verify the economic activity of each of these taxpayers on a case-by-case basis.
Of course, in our example, this increase in efficiency is noticeable, but perhaps not espectacular. Now, if we think not of an agency with 1000 taxpayers, but of a whole with several hundred thousand or millions of taxpayers, this increase in efficiency can be significant.
Our example is simple, coming from of a small synthetic data set. In reality, our available dataset would grow significantly. We should add up the returns from previous periods, information received from third parties (such as banks or credit card operators) or information as detailed and voluminous as that coming from an electronic invoice that, to name a case, could help discriminate from the most frequent amounts of individual transactions to distinguish wholesale or retail trade very appropriately. These structured data could be complemented by other, less obvious ones, such as the corporate name of the taxpayers, (“hardware store, everything repaired”, gives us a good idea of what that taxpayer can do), added to unstructured sources, such as the advertising that taxpayers publish in media and social networks.
We will not then have a set of 6 variables, as in our example, but of thousands (perhaps more) elements of information associated with each taxpayer. The opportunities to do interesting things are enormous, as much as the complex developments necessary to achieve them. It is a fertile ground in which we hope to contribute to our member countries by sharing experiences, lessons learned or, why not, developing algorithms appropriate to our environment, available to the administrations that want to use them. That is precisely the goal behind the idea that we have to create a Center of Advanced Analytics and Artificial Intelligence within CIAT, with the participation of “data scientists” and specialists from our administrations, experts from the academia, private enterprise and independent consultants, operating primarily with open source tools and producing knowledge, good practices and algorithms in aspects as varied as the verification of the data quality, data anonymization and, of course, use of artificial intelligence, which, in spite of the appearance, is not magic.
Greetings, good luck, and Happy (and vaccinated) New Year.
7,843 total views, 11 views today
1 comment
This is my first comment here, so I just wanted to give a quick shout out and say I genuinely enjoy reading your articles. Your blog provided us useful information. You have done an outstanding job.